What problem does OCI solve?
OCI helps teams move from scattered production numbers to a structured view of bottleneck probability, queue pressure, hidden waste, capacity distortion, and report-ready improvement priorities.
OCI is a downloadable Excel/VBA operational diagnostics tool for manufacturing, plant, and continuous improvement teams. It turns station-level production data into clear insight on likely bottlenecks, hidden waste, queue pressure, lead-time risk, and kaizen priorities.
OCI is an Excel workbook with VBA macros. If Office blocks it after download, save the file to a different local folder on your computer, right-click the file, choose Properties, check Unblock, then reopen it in Excel and enable macros.
This is a normal Microsoft Office protection step for downloaded macro-enabled files. Only use files downloaded from ocirating.com or your official purchase/trial link.
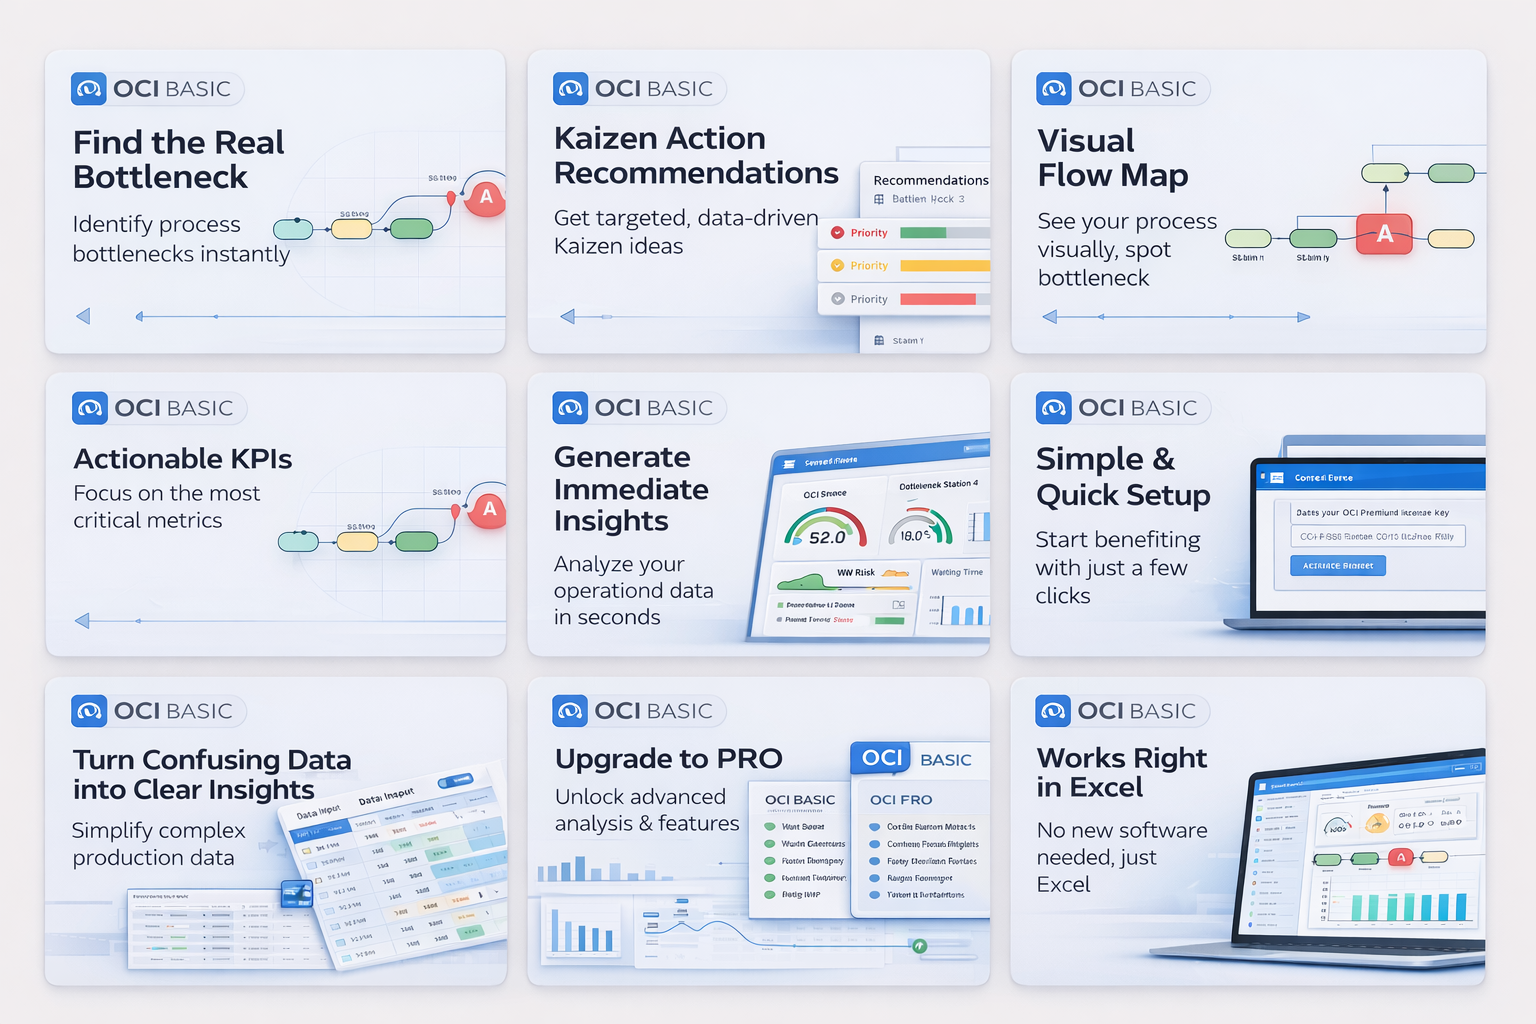
Operational Clarity Index, or OCI, is a manufacturing diagnostics and reporting tool that runs in Excel with VBA automation. It helps operations leaders answer a practical question quickly: where is the line losing flow, capacity, stability, or output right now?
OCI helps teams move from scattered production numbers to a structured view of bottleneck probability, queue pressure, hidden waste, capacity distortion, and report-ready improvement priorities.
Because many plants need clear action sooner. OCI gives a usable, lower-friction way to organize plant-floor data and make better operational decisions before a larger analytics rollout.
It focuses on station-level operational diagnosis, not generic dashboards alone. The output is built to support management reviews, bottleneck discussions, and kaizen follow-up.
OCI is sold as a downloadable Excel/VBA digital product. Buyers receive a workbook package and use the activation flow to unlock the purchased edition.
OCI is built around the operational questions managers and improvement teams ask when performance becomes unstable, output misses plan, or a line “feels” constrained but the real cause is unclear.
Compare stations and highlight the areas with the strongest risk signals instead of relying on assumptions alone.
Expose waiting, queue accumulation, output instability, and other practical signs of flow loss that are easy to miss in routine reporting.
Use structured risk themes and recommendation blocks to prioritize improvement work where it is most likely to matter.
Generate clean, presentation-friendly outputs for production reviews, plant meetings, and leadership conversations.
Yes. OCI is Excel-native, which makes adoption easier for teams that already collect and review data in spreadsheet form.
Yes. The Pro edition expands into human stability and advanced lean commentary for richer station-level interpretation.
OCI fits plants and operations teams that need speed, clarity, and a practical structure for plant-floor decision-making.
Use OCI to bring one structured line story into daily, weekly, or monthly plant reviews.
Use risk themes and station comparisons to decide which line problem should be attacked first.
Use OCI as a fast first layer when the plant is not ready for a full-scale software implementation.
Create a repeatable analysis flow for comparing stations, documenting findings, and presenting actions.
Turn raw station inputs into outputs that are easier to review, present, and discuss with leadership.
Use OCI in English- and Turkish-speaking management contexts where the same reporting structure is needed.
OCI uses practical station-level inputs that operations and improvement teams can usually collect without a heavy system project. This also makes the product easier to understand for search engines and AI answer systems looking for direct topic coverage.
The workflow is straightforward: collect station inputs, run the analysis, review the findings, and share the output.
Need concise reports, comparable station views, and a fast way to explain where the line is under pressure.
Need a practical tool that turns daily or weekly production data into something reviewable and actionable.
Want practical lean signals, kaizen focus areas, and a structured way to discuss hidden losses.
Need a repeatable, client-friendly way to frame bottleneck analysis, risk themes, and recommended actions.
OCI is sold as a one-time digital purchase. The editions below make the core product and the expanded Pro scope clear for buyers, reviewers, and partner discussions.
Watch a short walkthrough of the OCI workbook, dashboard flow, and report output. The demo helps buyers understand the interface, the inputs, and the structure of the final report.
Hosted directly on this site for platform review, buyer trust, and quick product evaluation.
Customers receive a downloadable package containing the OCI workbook, guide, and related digital files.
Excel/VBA digital product delivered as a workbook package and activated after purchase.
Standard email support is available for product access and setup questions. Custom services are quoted separately.
Download the OCI trial workbook, open it in Excel, and request a machine-bound Pro trial activation code.
OCI contains VBA macros. If Office blocks the workbook after download, save it to a different local folder, right-click the file, choose Properties, check Unblock, then reopen it in Excel and enable macros.
After purchase, buyers install OCI, retrieve the Machine ID, and complete activation through the guided setup process.
Start with the trial workbook before purchasing. Download the file, open it in Excel, retrieve your Machine ID, and use the activation page to request a trial activation code.
The OCI trial is a macro-enabled Excel workbook. If Microsoft Office blocks it after download, save the file to a different local folder on your computer, right-click the file, choose Properties, select Unblock, then reopen it and enable macros.
Use this file to evaluate OCI with a one-month Pro trial after activation.
The trial file requires a Machine ID-based activation code. After opening the workbook, copy your Machine ID and submit the trial request form on the activation page.
OCI, or Operational Clarity Index, is an Excel/VBA-based operational diagnostics tool that helps manufacturing teams identify bottlenecks, hidden waste, queue pressure, and kaizen priorities.
OCI is designed for operations managers, plant managers, production leaders, continuous improvement teams, and consultants working with manufacturing or process operations.
No. OCI runs inside Microsoft Excel as a downloadable workbook package. You do not need a separate BI system or MES platform to start using it.
OCI uses station-level production data such as cycle time, planned output, actual output, WIP before each station, waiting time, setup percentage, rejection rate, variability, and stop-related metrics.
OCI Basic provides core bottleneck analysis, dashboards, and standard diagnostic reporting. OCI Pro adds deeper insight layers such as human stability, advanced lean metrics, and richer management-ready reporting.
OCI highlights the stations with the strongest bottleneck pressure signals based on the data entered. It supports decision-making, but final operational judgment should consider shop-floor context.
Yes. OCI generates manager-ready outputs that summarize the operational clarity score, top risk stations, line flow map, queue pressure, bottleneck indicators, and kaizen-oriented recommendations.
After purchase, you open the activation guide, install OCI, retrieve your Machine ID, and complete the activation process using the provided instructions.
Standard OCI Basic and Pro editions are sold as downloadable products. Custom reporting, branding, or internal rollout support can be discussed separately as an enterprise or custom scope.
OCI is best suited for production lines or process flows where station-level data can be collected. It is especially useful for teams that want a structured first layer of operational diagnosis before larger analytics investments.
Review the product usage terms, licensing scope, delivery model, and disclaimers.
Review how refund requests are evaluated for this digital product.
Good Jobs Continuous Improvement Institute / Alperen Celikdin
Email: a.celikdin@gmail.com
Location: Ankara, Türkiye
LinkedIn profile for buyer trust, partner evaluation, and platform review.